TECHNOLOGIES

All technologies

Need assistance? Talk to the expert

MageCloud Customers

Discover how ecommerce businesses worldwide use MageCloud to power their success.

How to Improve Magento 2 Performance: Profiling with Tideways

Why profile the code? Systems like Magento 2 slow down with more content and extensions. Tideways is a simple and convenient profiler.

Picture of Paul Ryazanov
Paul Ryazanov

CEO, MageCloud | eCommerce Consultant & Speaker

I already have my own ecommerce store!
Any expert advice to share?

I have some questions, and I’m looking for guidance
from an e-commerce expert.

TABLE OF CONTENTS

To improve Magento 2 performance, at first, you have to find the performance issues. To do that, you need to have a good profiler.

Profiling your slow Magento 2 backend

Profiling is the collection of data on the execution of various programs (files and functions). It is not a process of optimising or changing programs. The result of this process is usually a comprehensive report on the program’s components and statistics on the execution of functions. Based on this report, we can optimise the program’s execution speed.

Why profile the code?

Every system performance slows down after it is loaded with more content and extensions. Magento 2 performance is no exception. The use of profiling becomes useful when the question of program optimisation arises. You need to find out and understand which segments of code are running slowly, which need to be optimised, find broken code, etc. The code profiling procedure should go first in the application optimisation process. Any other action will be conjecture and most likely wrong. You need to know what exactly causes the problems and “brakes.” The result of profiling is usually a list of performed functions together with the time of their execution.

Which profiler to choose?

There are many PHP registration tools (Zend Xdebug, BlackFire, etc.), but not all tools are suitable for direct website analysis. Most of them have significant overheads and cannot be used in the production environment.

On the other hand, the problems on a “live” site may not be the same as in the development environment. Profiling only on the developer’s computer will show only part of the problem.

Magento 2 provides a Profiler “out of the box.” However, in my practice, it has never been used.

Tideways XHProf Extension is a hierarchical Profiler for PHP, forked from the XHProf extension initially developed by Facebook. The Tideways is a convenient and straightforward profiler that can effectively collect application statistics almost without slowing down your application (or your site) and can be used for production Magento 2 website profiling with a little overhead.

Tideways profiler: how to configure

Step 1.

To start working with Tideways, you need to create an account on Tideways:

Step 2.

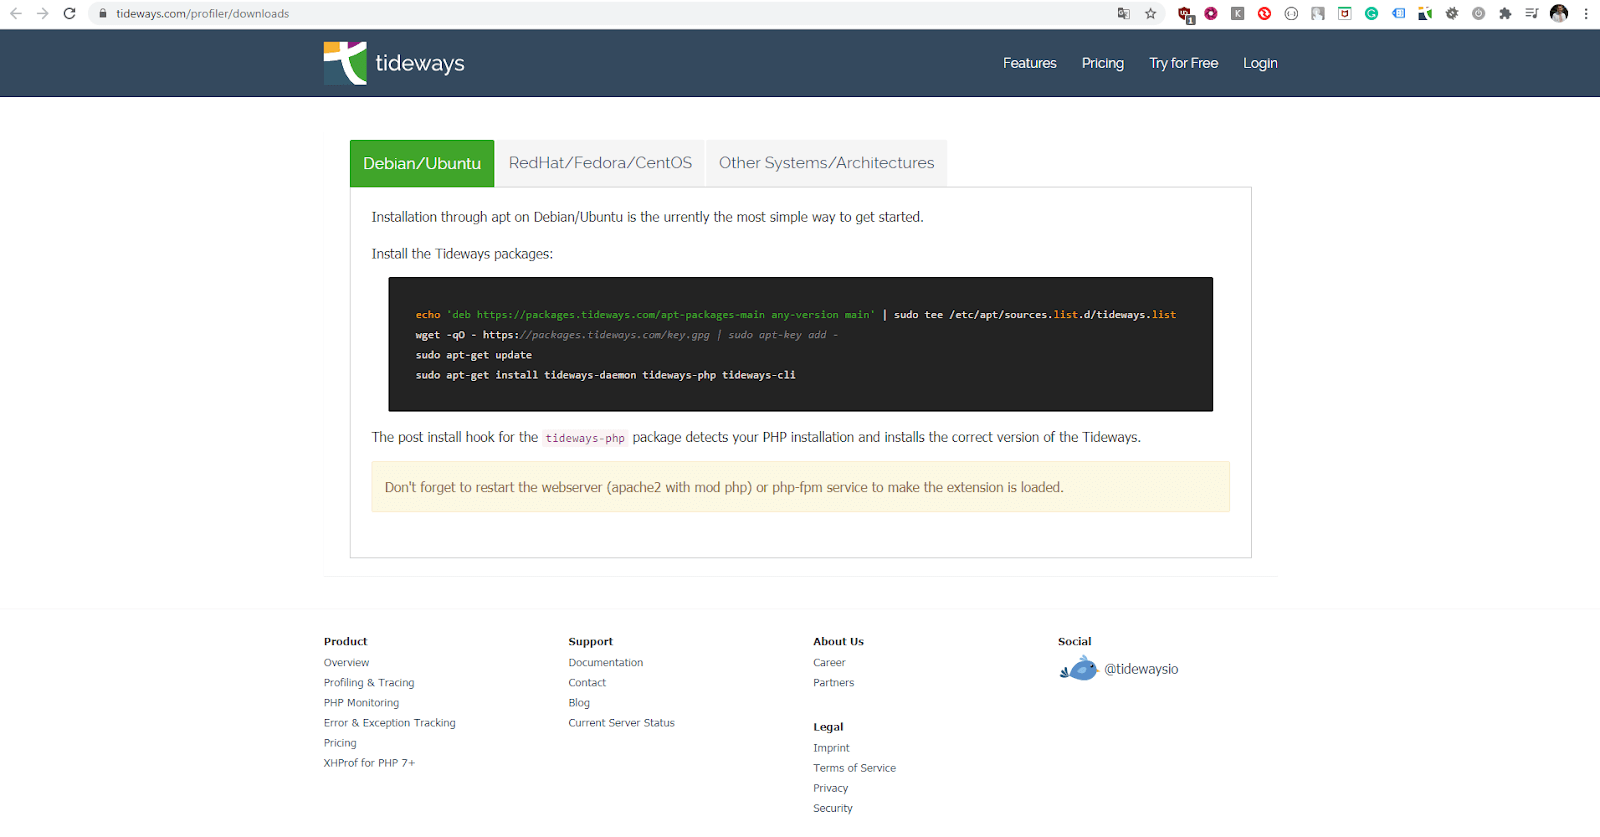
Then, depending on your server environment, you need to install and configure this extension according to the official documentation:

Step 3.

The last step is to configure Magento 2 adding settings to a file app/bootstrap.php:

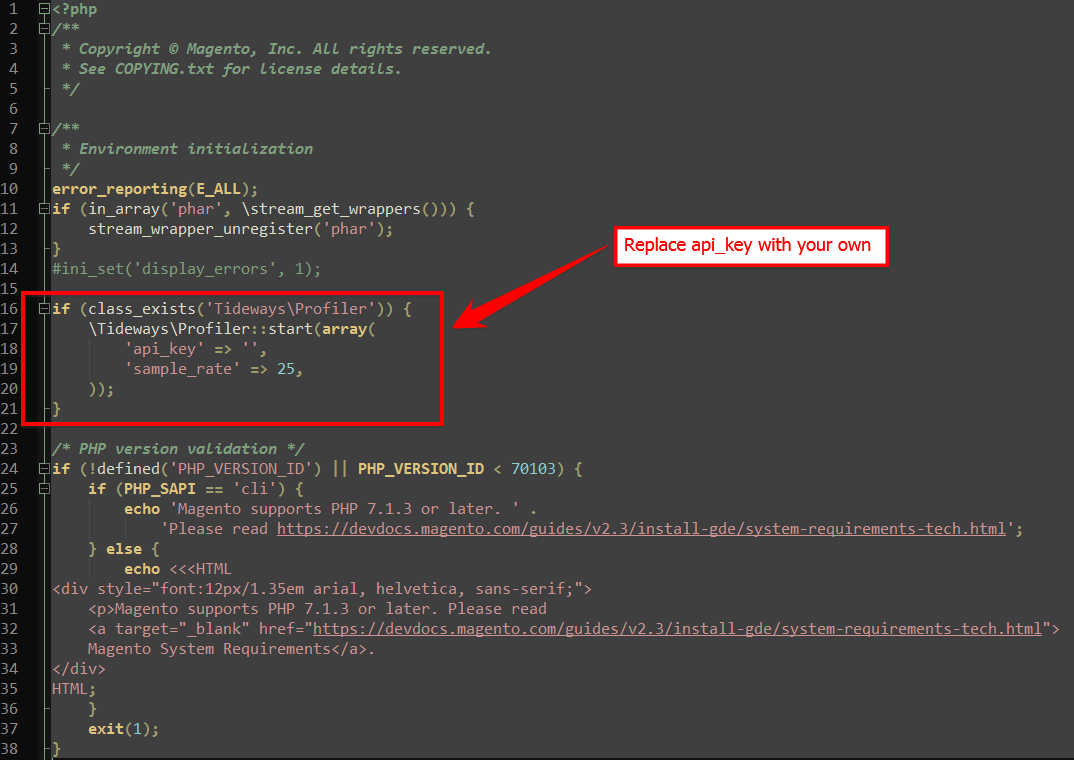
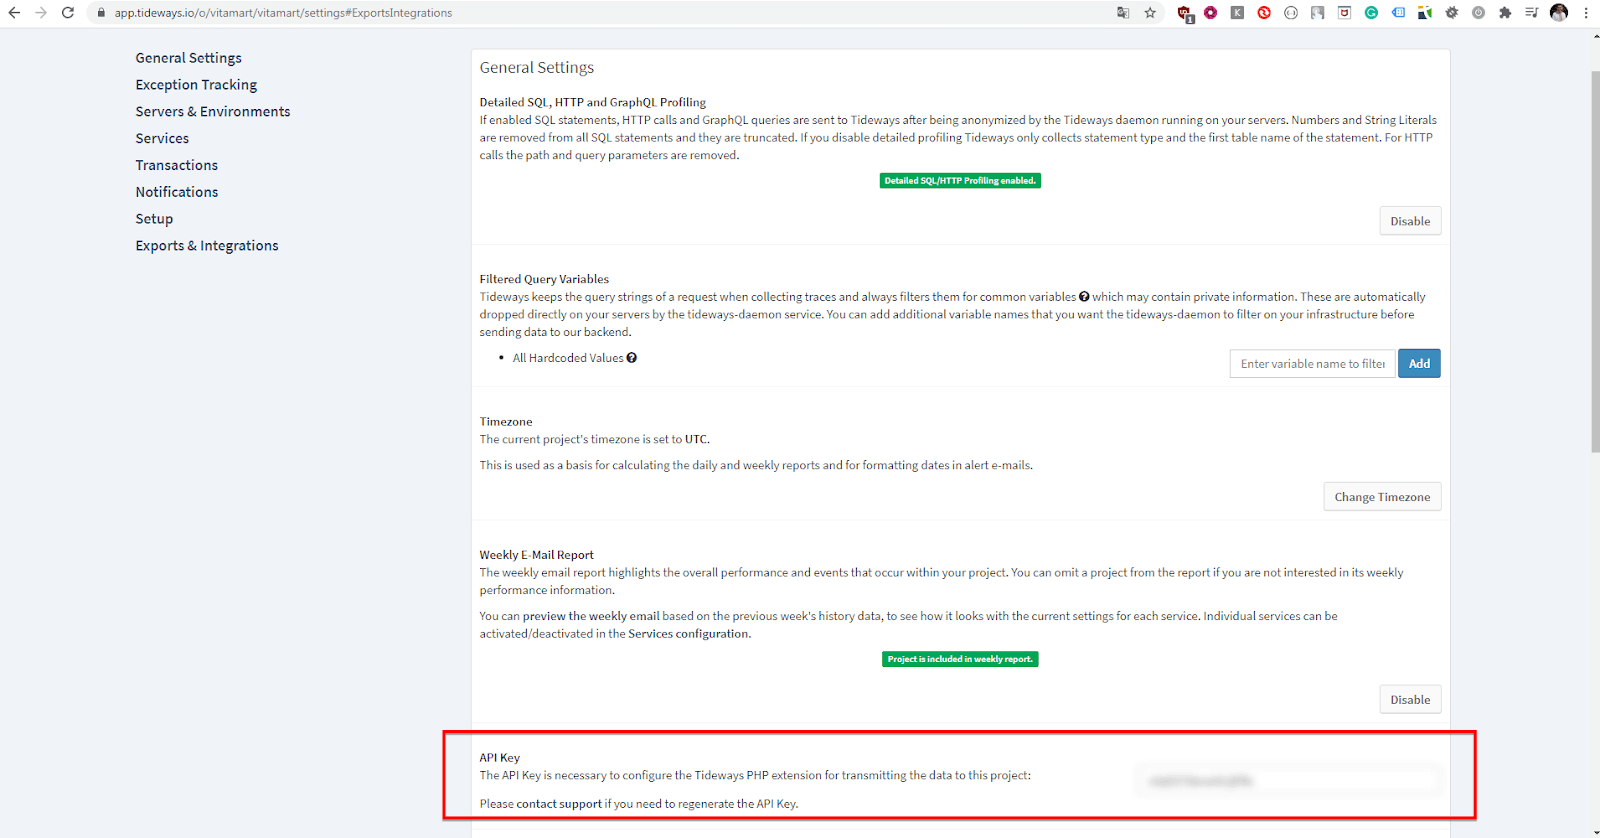
You can find an API key in General Settings in your Tideways account:

Then we can start “researching the code”.

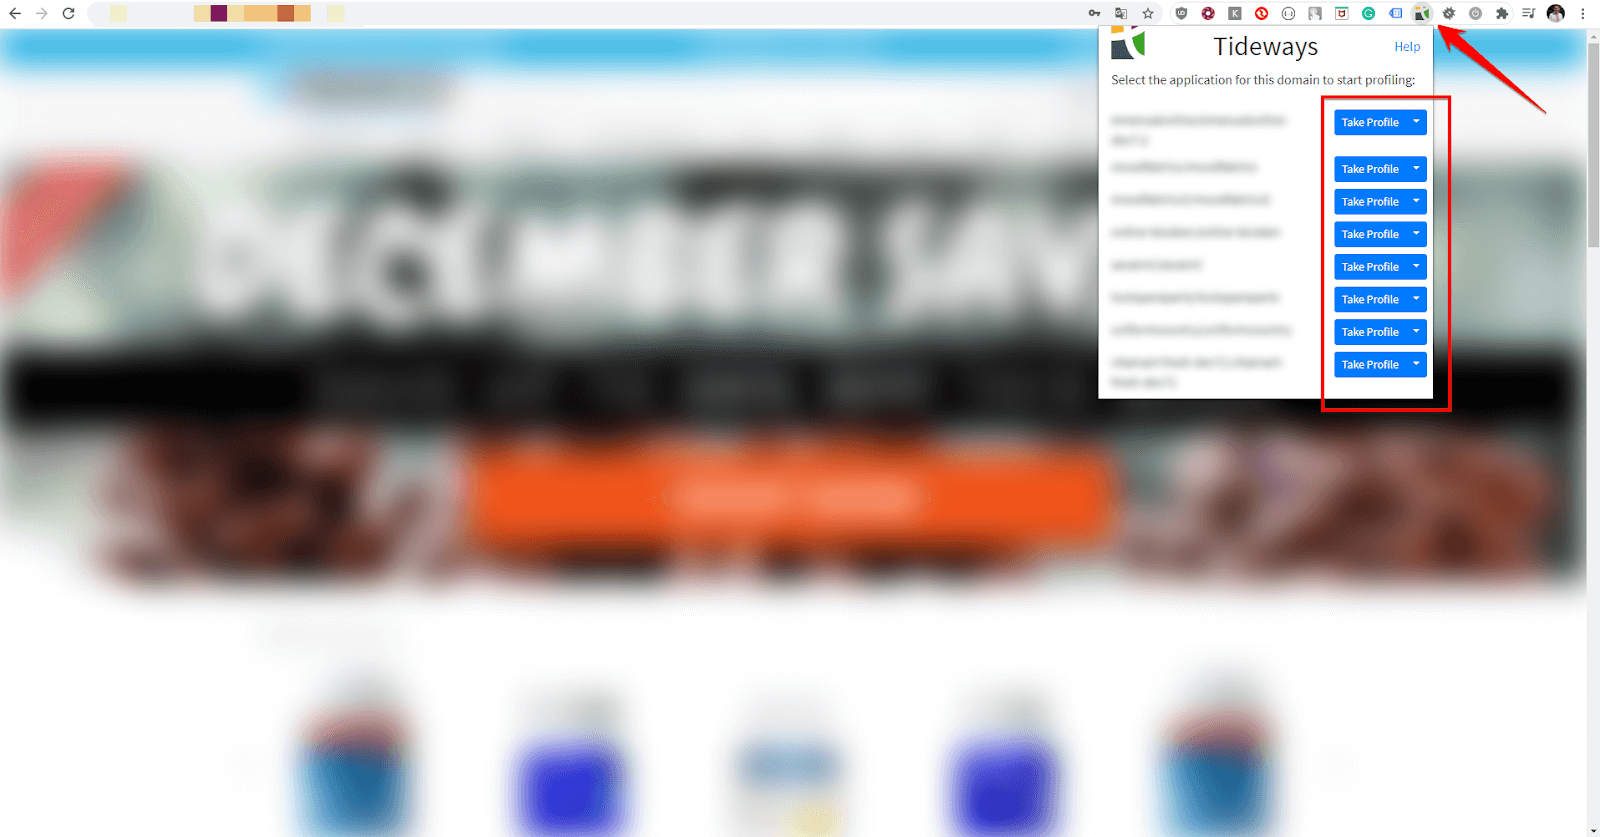
The Tideways interface provides several methods to trigger profiling:

Method 1. Using a Commandline:

Method 2. Using Tideways Chrome Extension

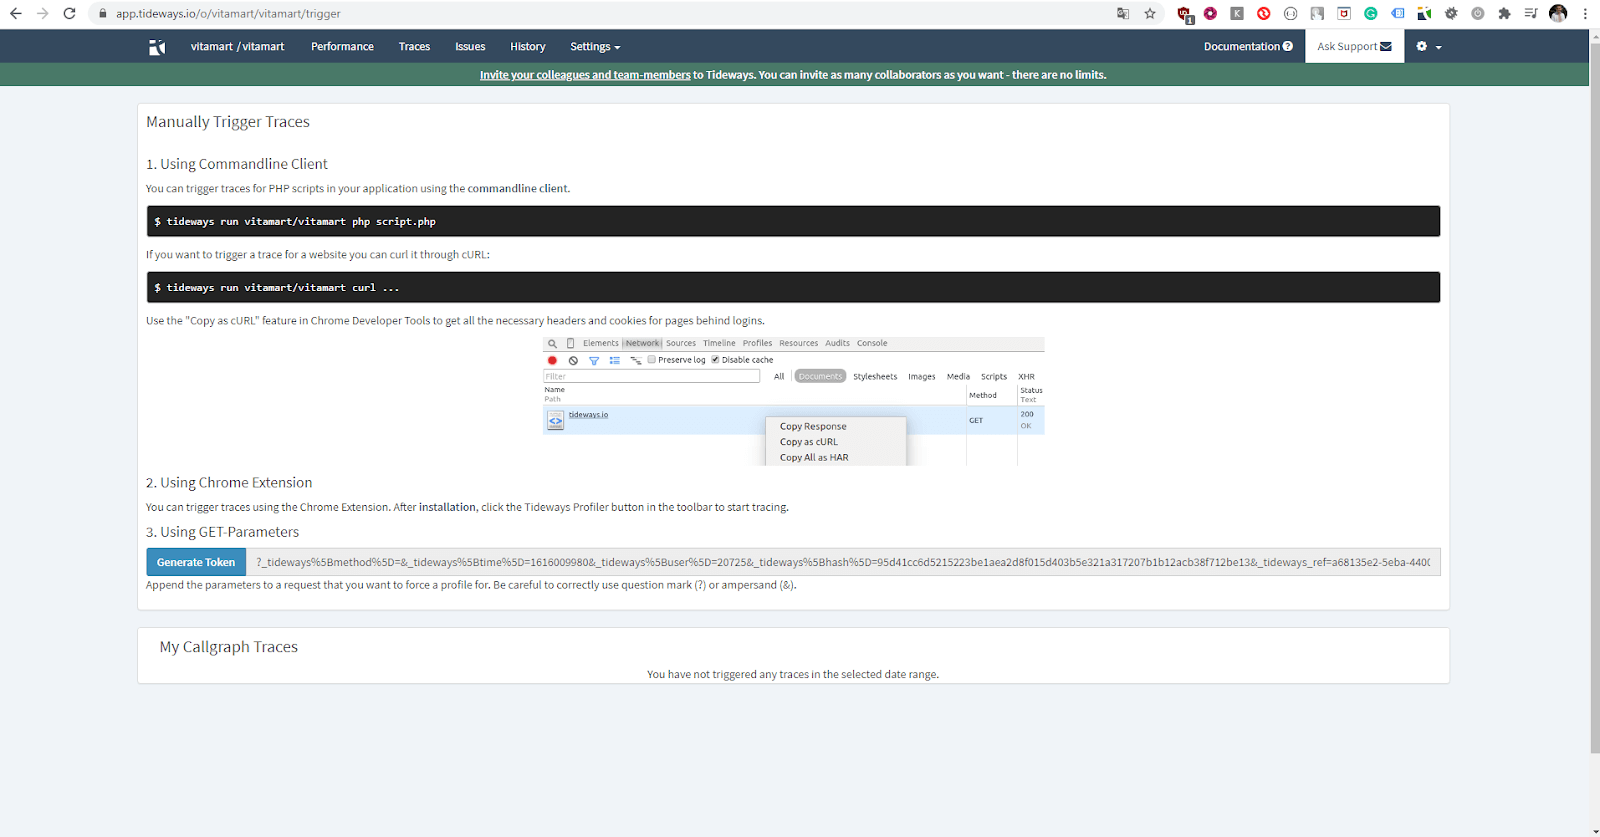
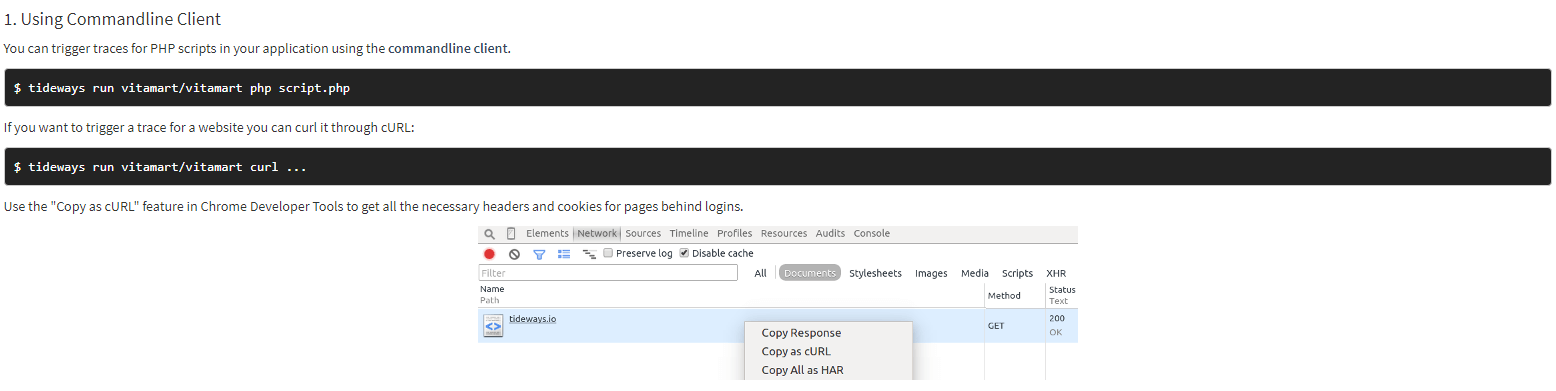
(To download: Tideways Chrome extension)

Method 3. Using a query string:

Simply add the generated query string to profile the desired page:

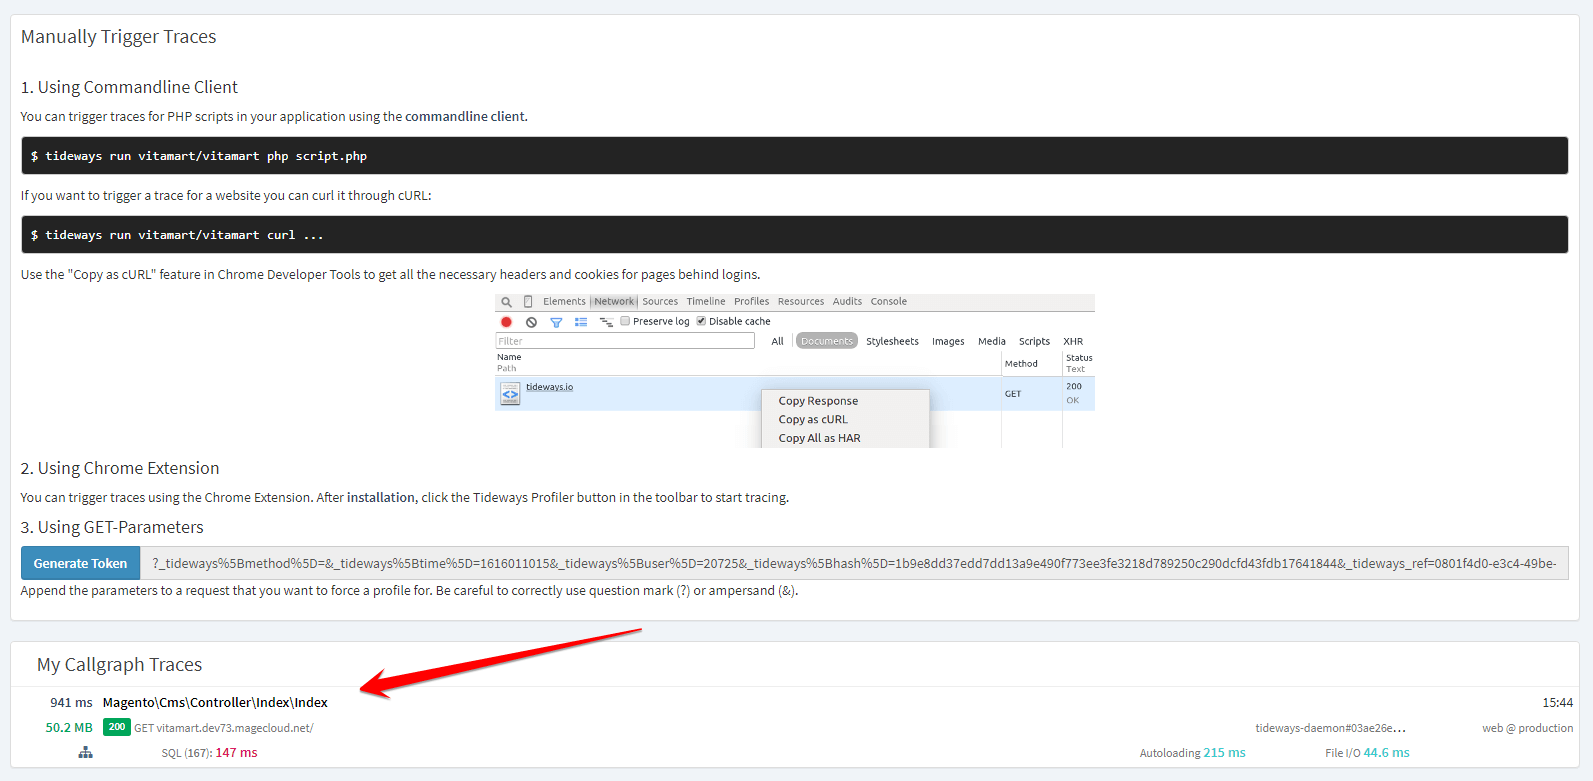
The simplest way to get around a Magento 2 FPC (Full Page Cache) is to trigger it by adding a query string.

  1. On the Magento Admin sidebar, go to Customers to check for some unusual stuff (e.g., whether customers from other countries (.ru or .cn) are pushing lousy content to your site, even if they have valid emails).

2. Similarly, go to Marketing > Reviews on the Admin sidebar to check the unrelated content possibly attacking your website.

3. Finally, on the Admin sidebar, go to Marketing > Newsletters to check the requests in the newsletter area and check here for suspicious entries.

These issues are elaborated further in this video ⬇️⬇️⬇️

Profiling in action

We will not describe optimisation methods for Magento 2 based on profiling, because this is an entirely different topic; we will only consider the possibilities of Tideways in terms of profiling. Also, we will omit the description of all settings and will focus only on the core profile capabilities.

Assume we had a Magento 2 project which needs to be profiled. For example, let’s trigger profiling for the home page. Add a query string provided by Tideways into the store home URL and refresh the page. In Tideways we will now see the available Callgraph Traces:
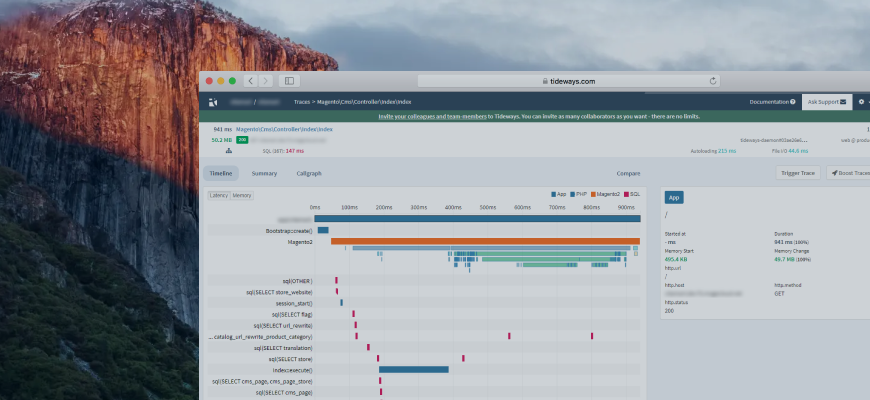
Timeline

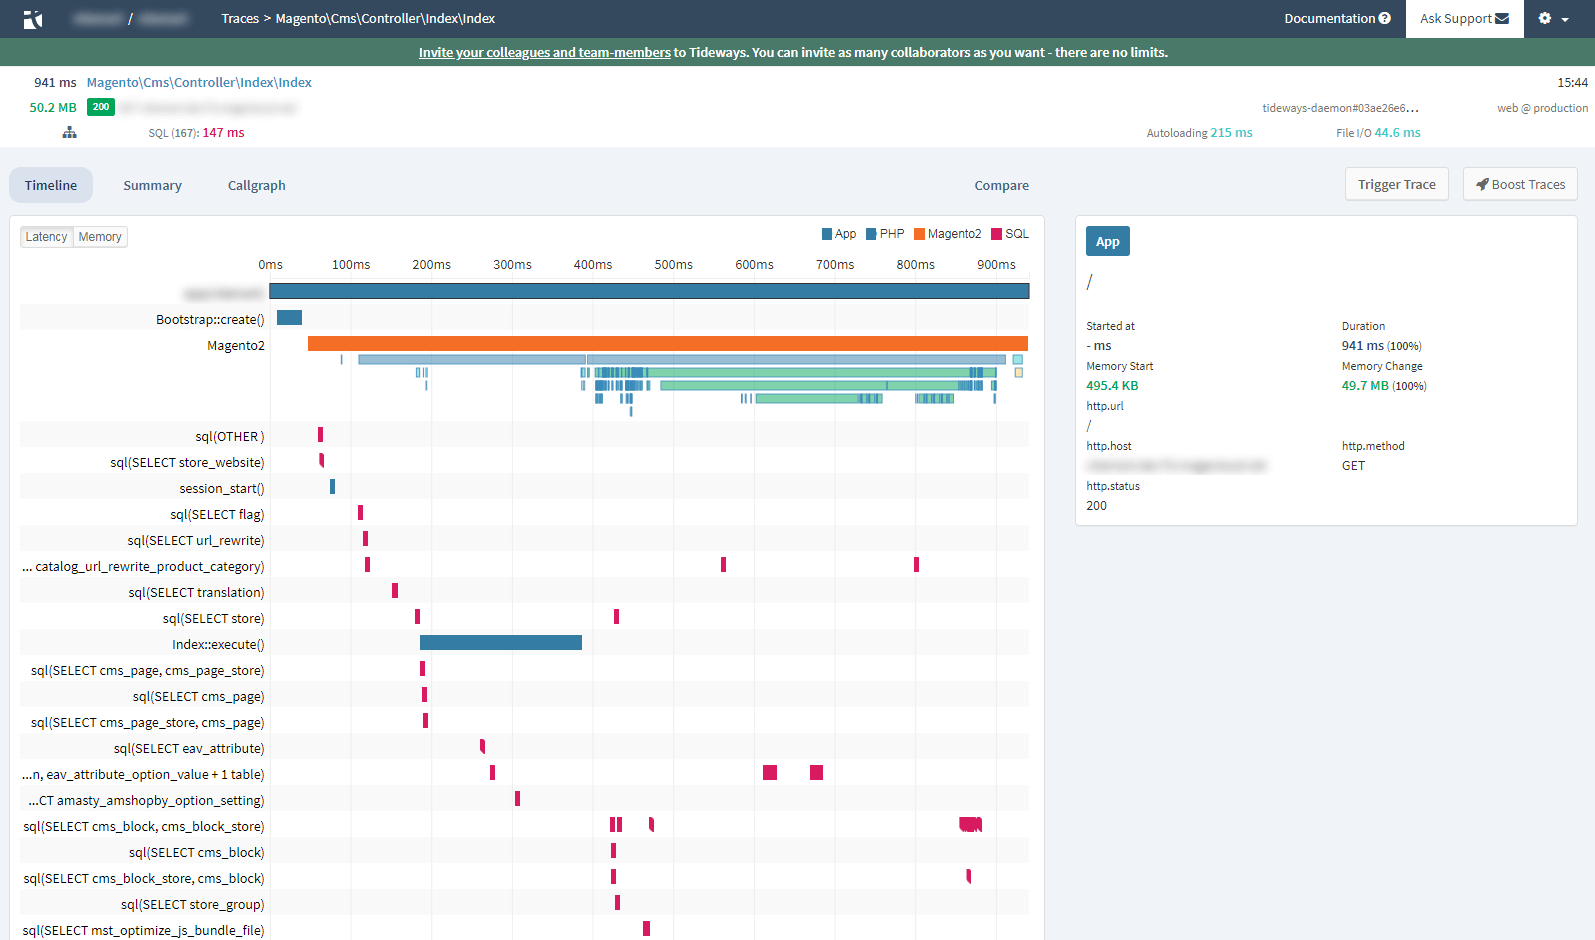
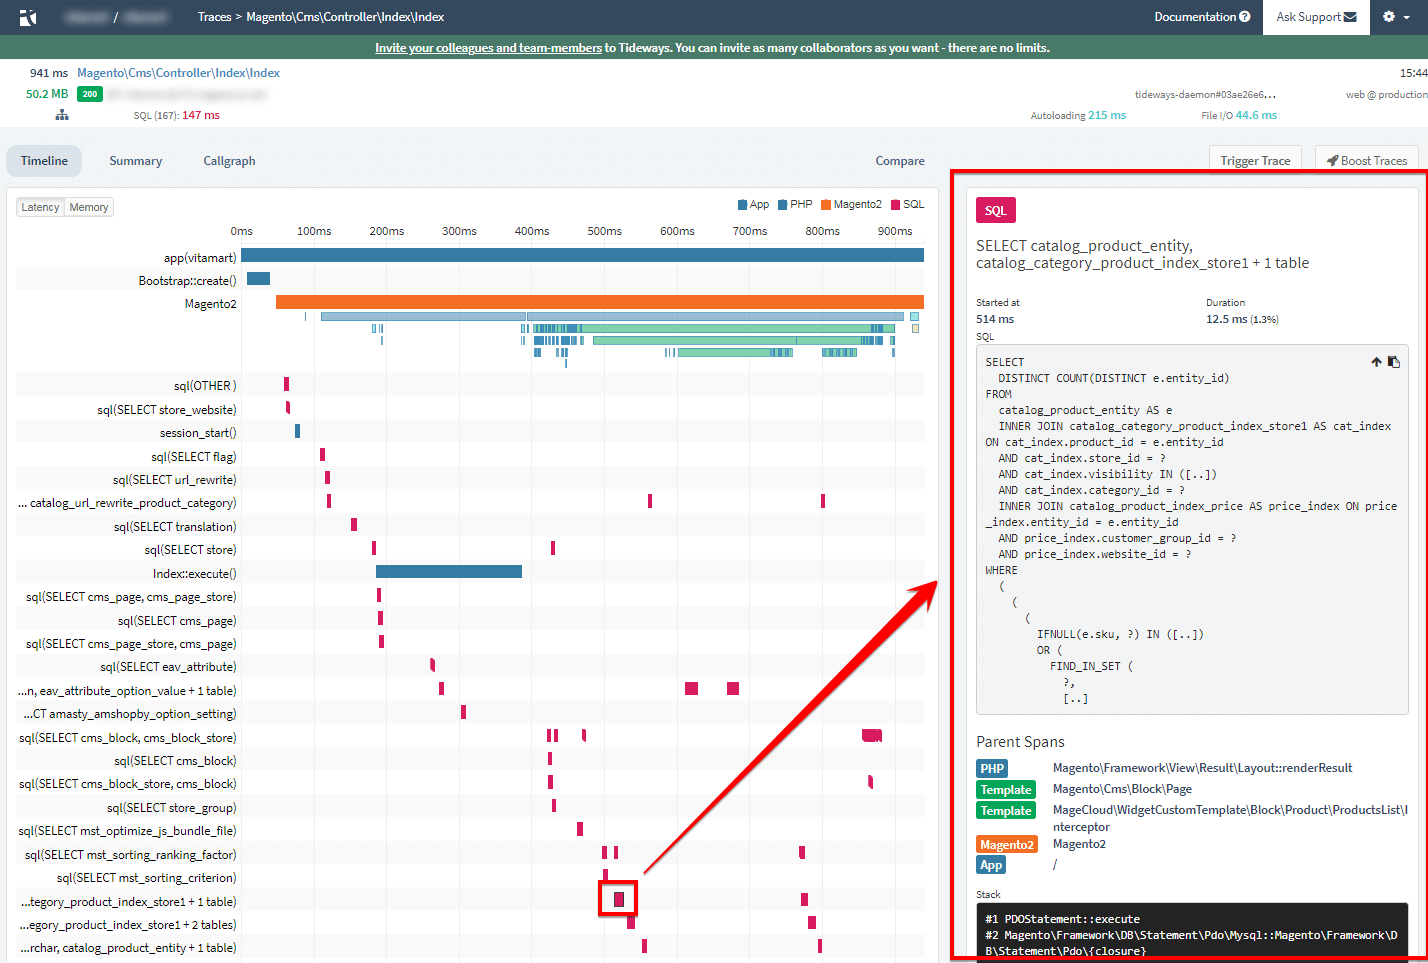
The Timeline profiler collects information about a range of operations performed by the Magento 2 application. In this particular case, we can notice that the request of our page returned an HTTP 200 OK response code, see that the request has been handled via Magento\Cms\Controller\Index\Index controller, Magento 2 generates 167 MySQL queries, the response of the page took 941 ms, consumed 50.2 MB of memory, etc. It’s the primary information you can see at the top of the page.

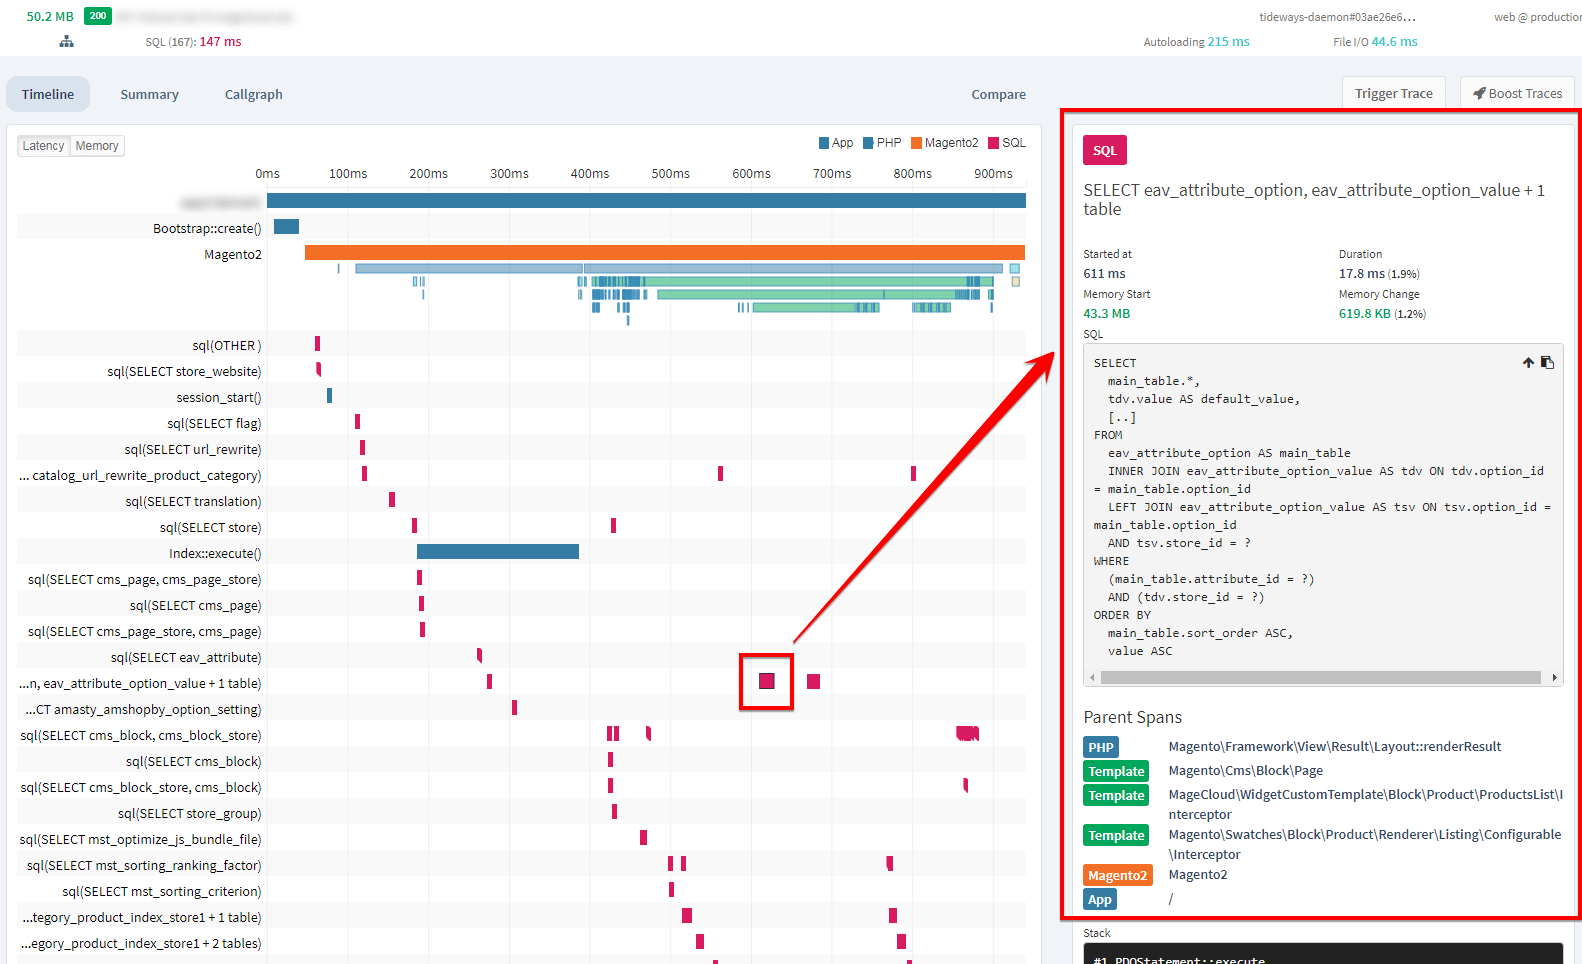
Also, for example, we can choose the SQL query, which collects EAV (Entity–attribute–value) attribute options data from the block Magento\Swatches\Block\Product\Renderer\Listing\Configurable.In the right sidebar, we will see all the necessary information about this query: execution time, memory usage, etc.

Another example shows the query which collects some products information to display on the page:
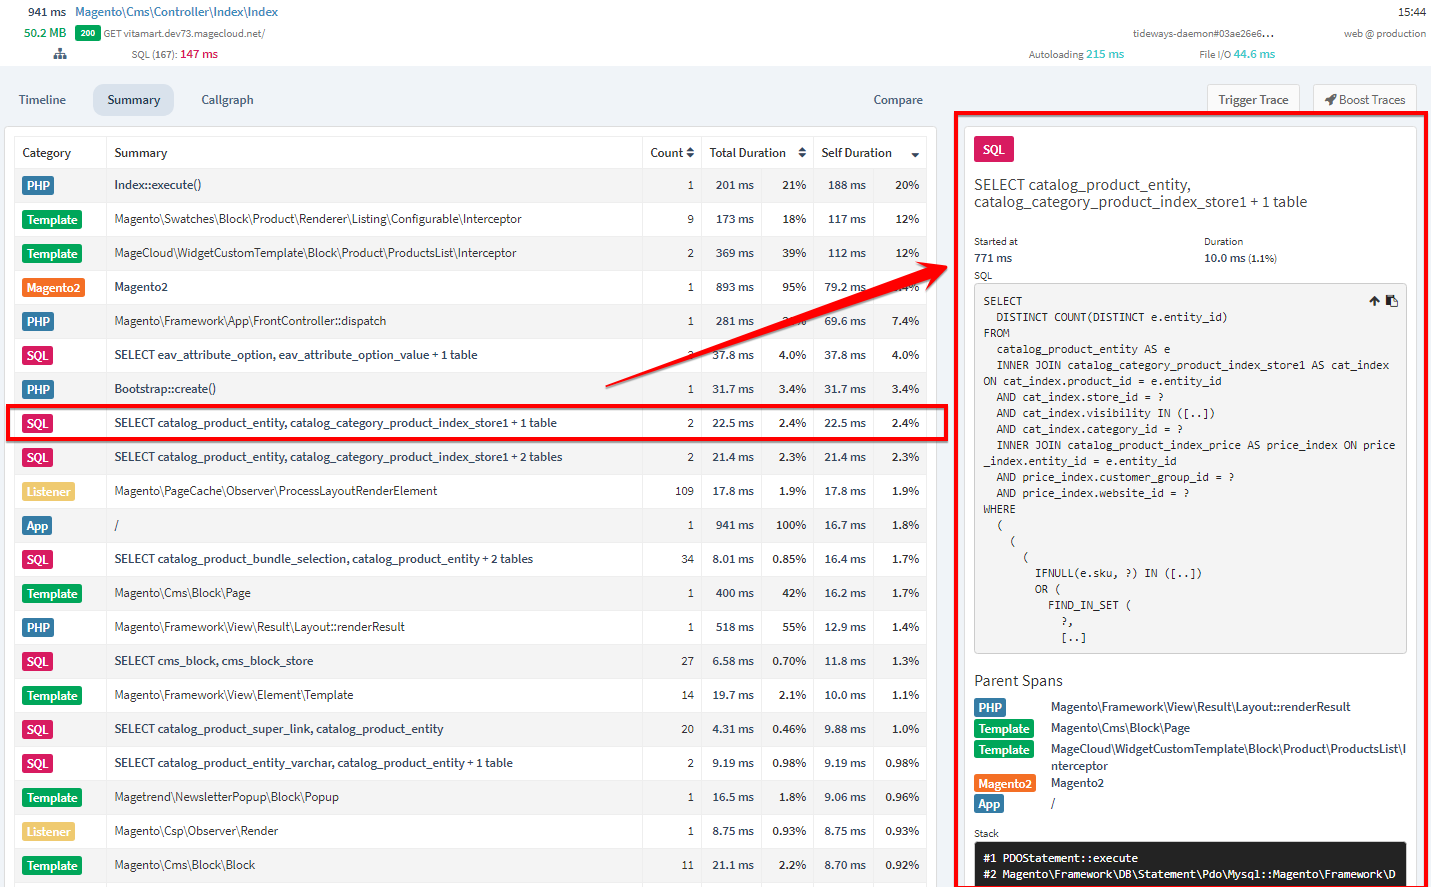
Summary

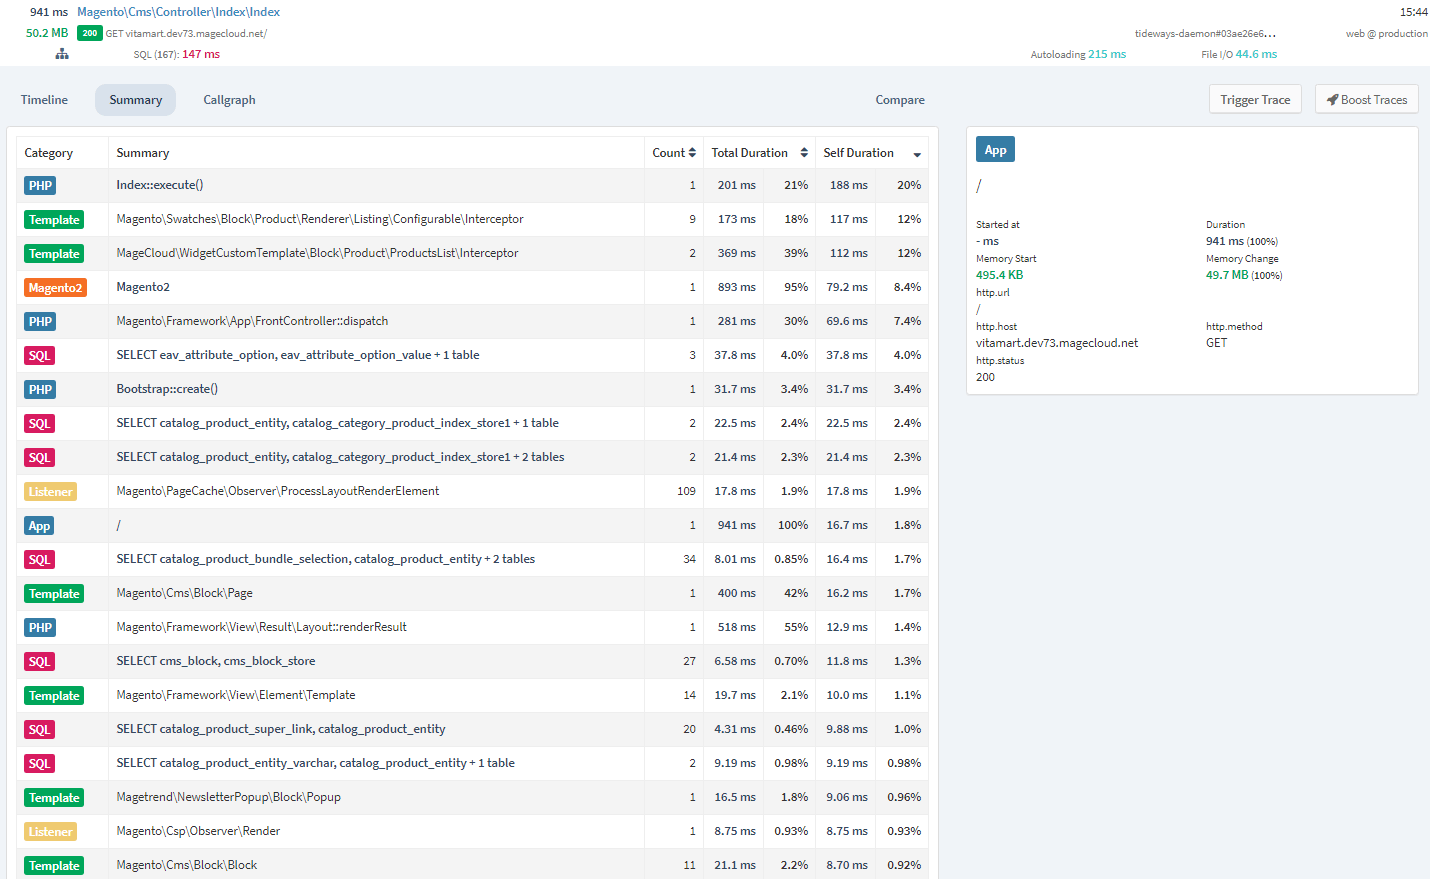
The Summary tab shows an extensive report about how all of the functions work.

The SQL functions are clickable to display the query information itself. For example, we can see that query below executes two times with self duration 22.5ms and with a total duration of 22.5ms:

Another example shows that the Magento 2 event core_layout_render_elemenеt was triggered 109 times with 22.3ms and 4.55ms respectively:

Callgraph


The Callgraph Profiler shows how much time was spent in each function on a call graph. It provides detailed insights into every function call of a PHP request. Let’s trigger one of the pages of the category and look at the results.

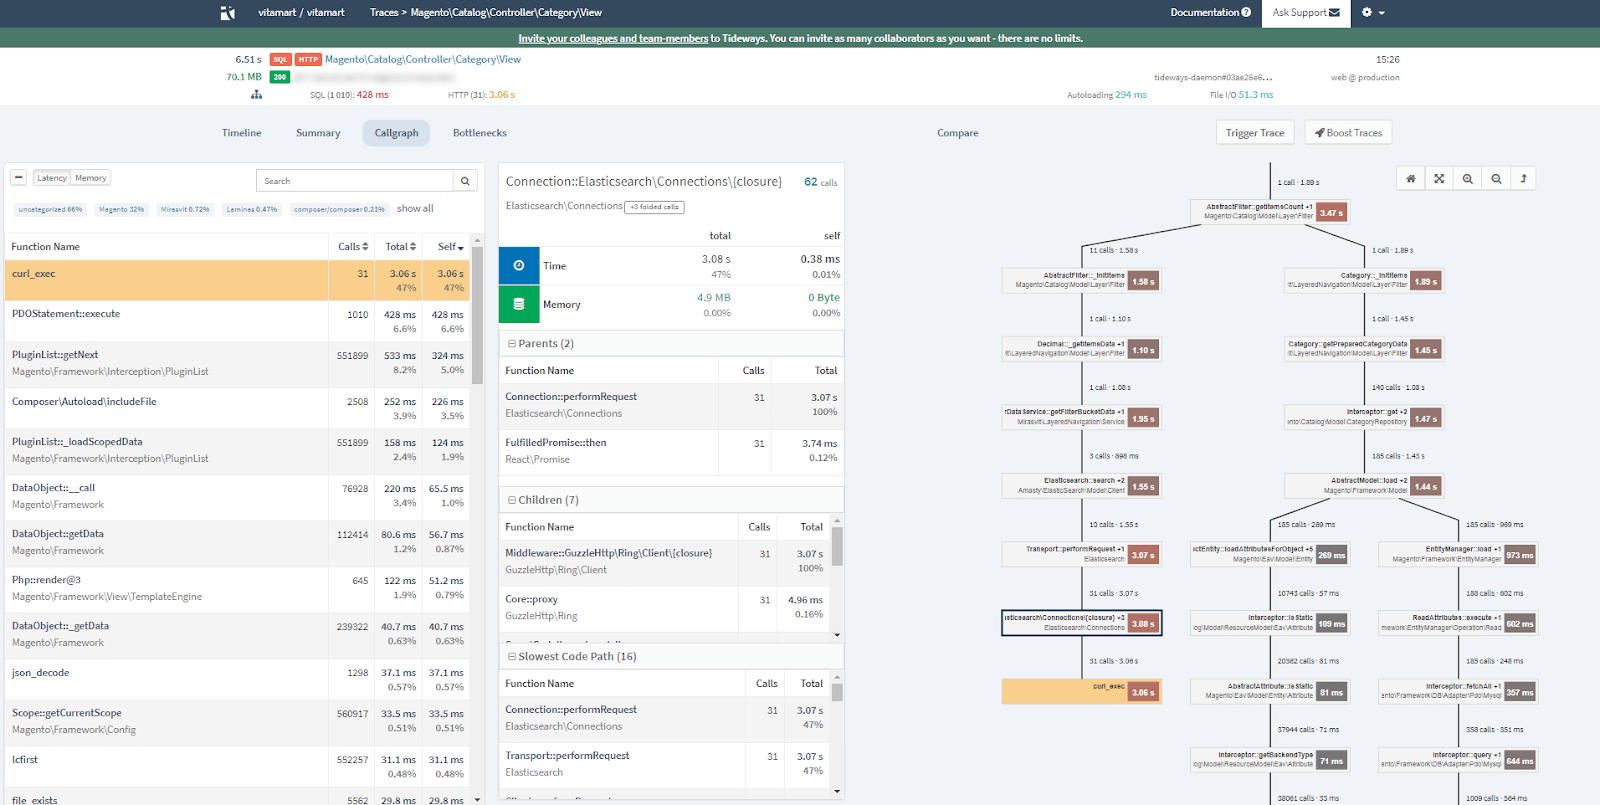
Resource-intensive areas of the code are highlighted in yellow (middle) and red (strongest). These are pieces of code that use a lot of resources relative to the rest of the program. It can be a slow function or a large number of fast function calls.

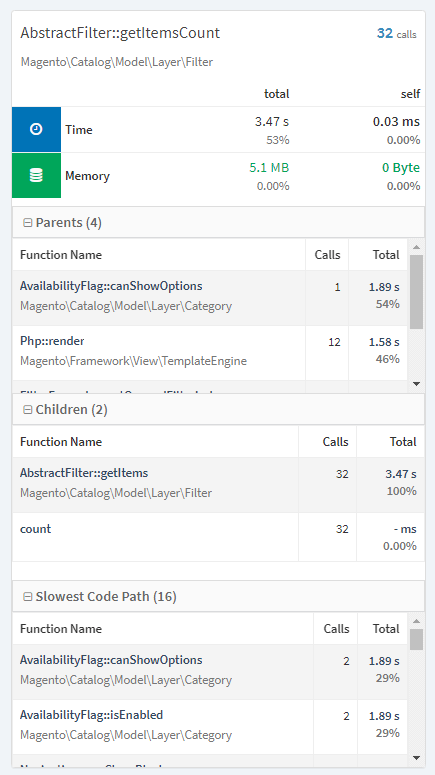
For example, we can see that for the call to function Magento\Catalog\Model\Layer\Filter\AbstractFilter::getItemsCount:

  • the total time was 3.47 seconds (53% of the total request)
  • the self-time was 0.03 milliseconds (0.00% of the total request)
  • the total memory used was 5.1 MB (0.00% of the total request)
  • the self memory used was 0 B (0.00% of the total request)
  • the function was, itself, called 32 times

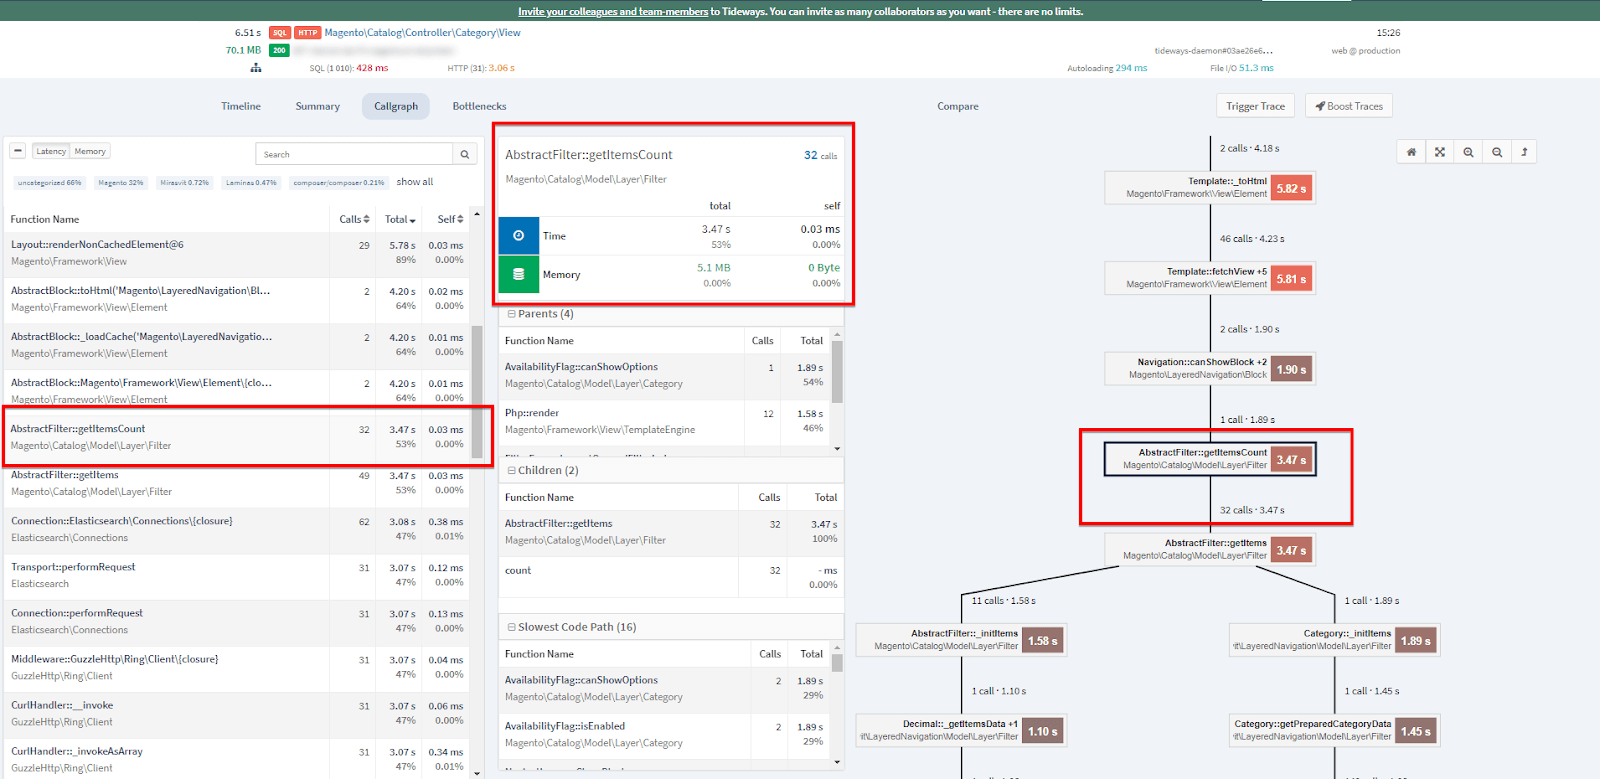
Also, we can see the parent calls, child calls, and slowest code path. The example above shows that the selected function has:

  • 4 parent functions, including Magento\Catalog\Model\Layer\Category\AvailabilityFlag::canShowOptions and Magento\Framework\View\TemplateEngine\Php::render
  • 2 child functions Magento\Catalog\Model\Layer\Filter\AbstractFilter::getItems and count;
  • 16 slow code paths, including Magento\Catalog\Model\Layer\Category\AvailabilityFlag::canShowOptions and Magento\Catalog\Model\Layer\Category\AvailabilityFlag::isAvailable

Each time a different function is selected, we can see how each view component is interlinked and changes.
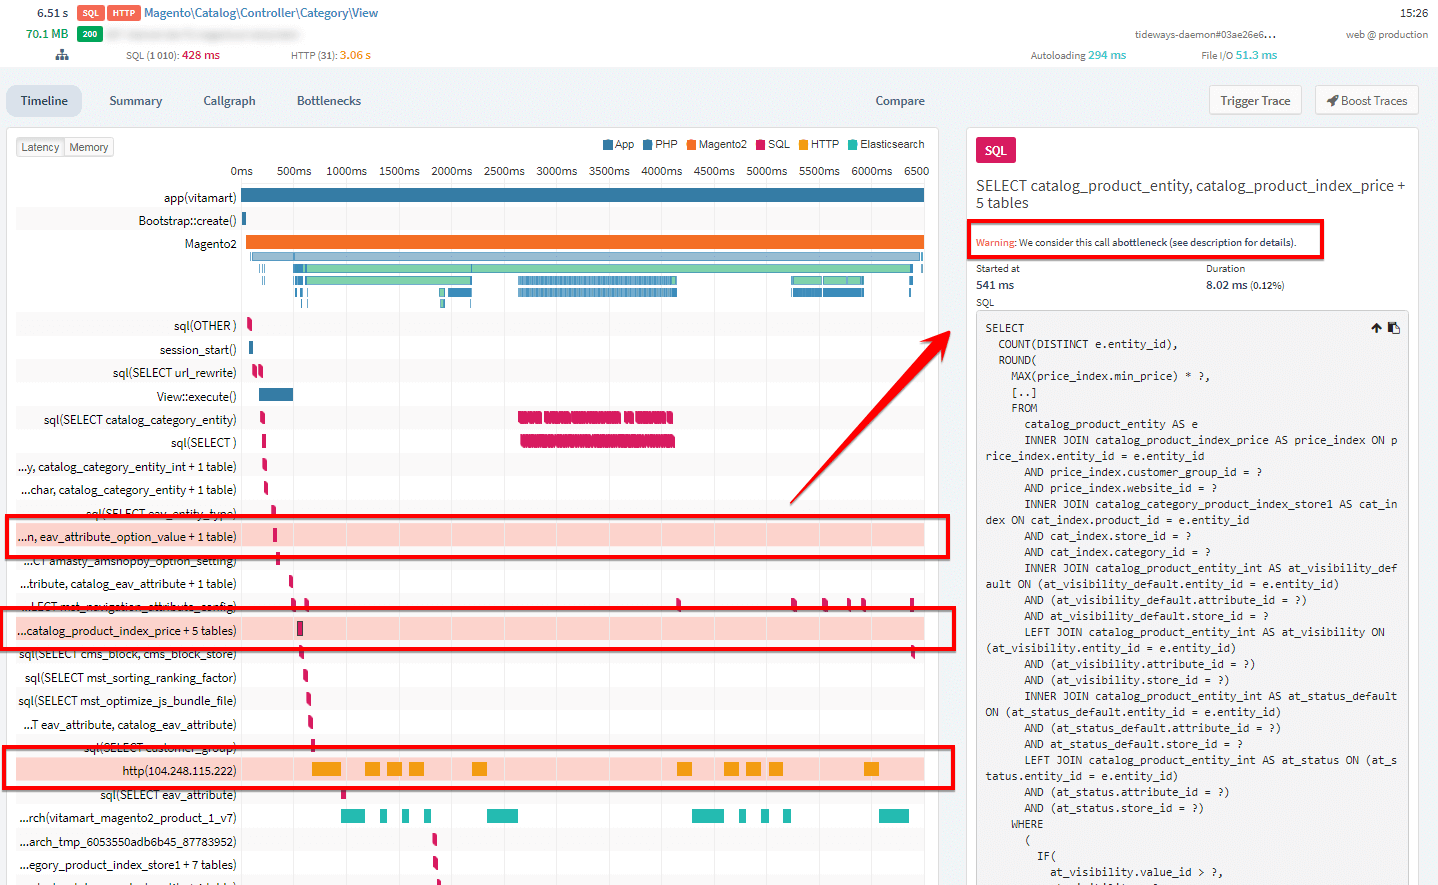
Bottlenecks


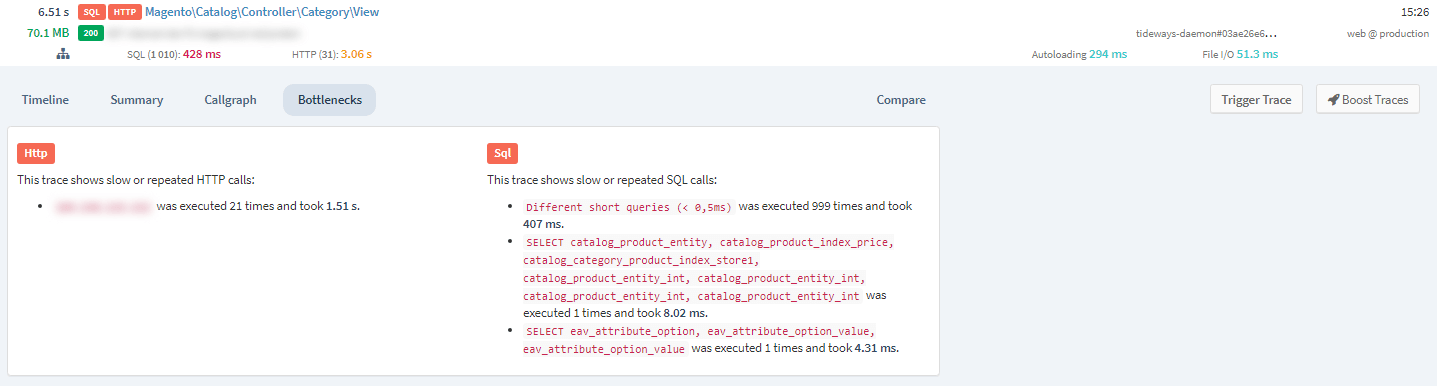
Tideways automatically detects some bottlenecks in our requests and gives us helpful clarifications about them. The Bottlenecks tab may display slow or repeated HTTP calls,
SQL calls, etc. In the example, we can see that the select, related to retrieving product information, was executed 1 time and took 8.02 ms. All the detected bottlenecks will be highlighted in red:

Ready to discuss your project?

Book a meeting with our expert Paul

How MageCloud Can Help

If you would like to know how MageCloud can assist with your Magento store, pleasecontact us to start discussing your requirements.


We analyse all aspects of your store and help you achieve the best performance possible.


To get a free video audit of your store, submit a form, and we’ll get back to you soon.

Have we piqued your interest?

Let us prove our skills and provide you with a free video review of your eCommerce site. Schedule a meeting with our team.
Cities we operate in